BY TALIP AKTAS
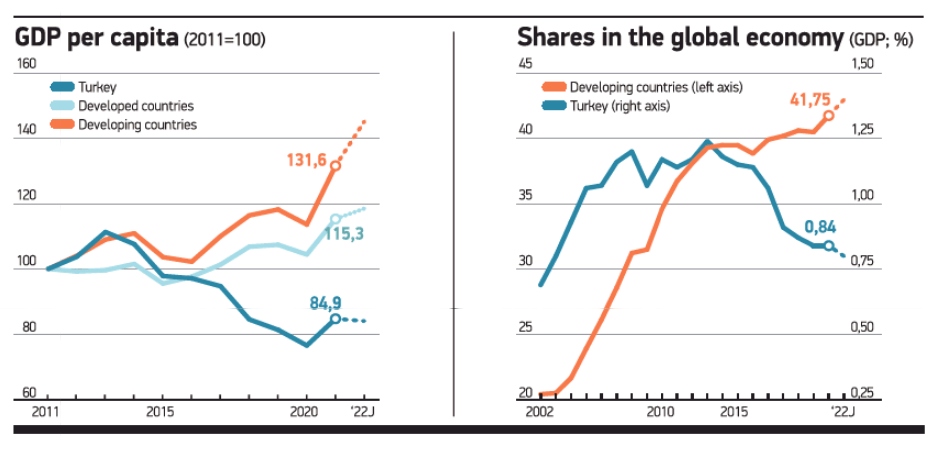
The economy grew by 7.5% and 7.6% in Q1 and Q2, respectively. The rate was above long-term averages. It was ‘loudly’ announced that Turkey showed the best performance in the OECD and G20. But the growth’s inclusiveness and quality, which prioritizes welfare, and its deflator based on controversial inflation data weren’t questioned. What has happened over the past 10 years when numbers are read correctly? Turkey’s GDP grew by 4.2-fold at current prices in 2011-2021. But the real GDP grew by 0.65-fold in the last 10 years. Turkey’s GDP, which stood at USD 838.5bn in 2011, USD 880.1bn in 2012 and rose to USD 957.4bn in 2013, fell to USD 806.8bn in 2021, on a downward course. It is expected to remain at this level in 2022. The real GDP decreased by nearly 4% in USD in 2011-2021. The USD-based contraction may approach 10% in 2012-2022. Developing countries, including Turkey, raised their share in the global economy from 20% to over 40% in the last 20 years. Turkey negatively differentiated – it contracted. The average GDP per capita was USD 10,700 in the world in 2011, while the figure was USD 11,220 in Turkey. The average GDP per capita rose by 17% to over USD 12,500 in the world in 2021 when it was down by 19% to USD 9,530 in Turkey.